Provide feedback on task output#
In this chapter we will:
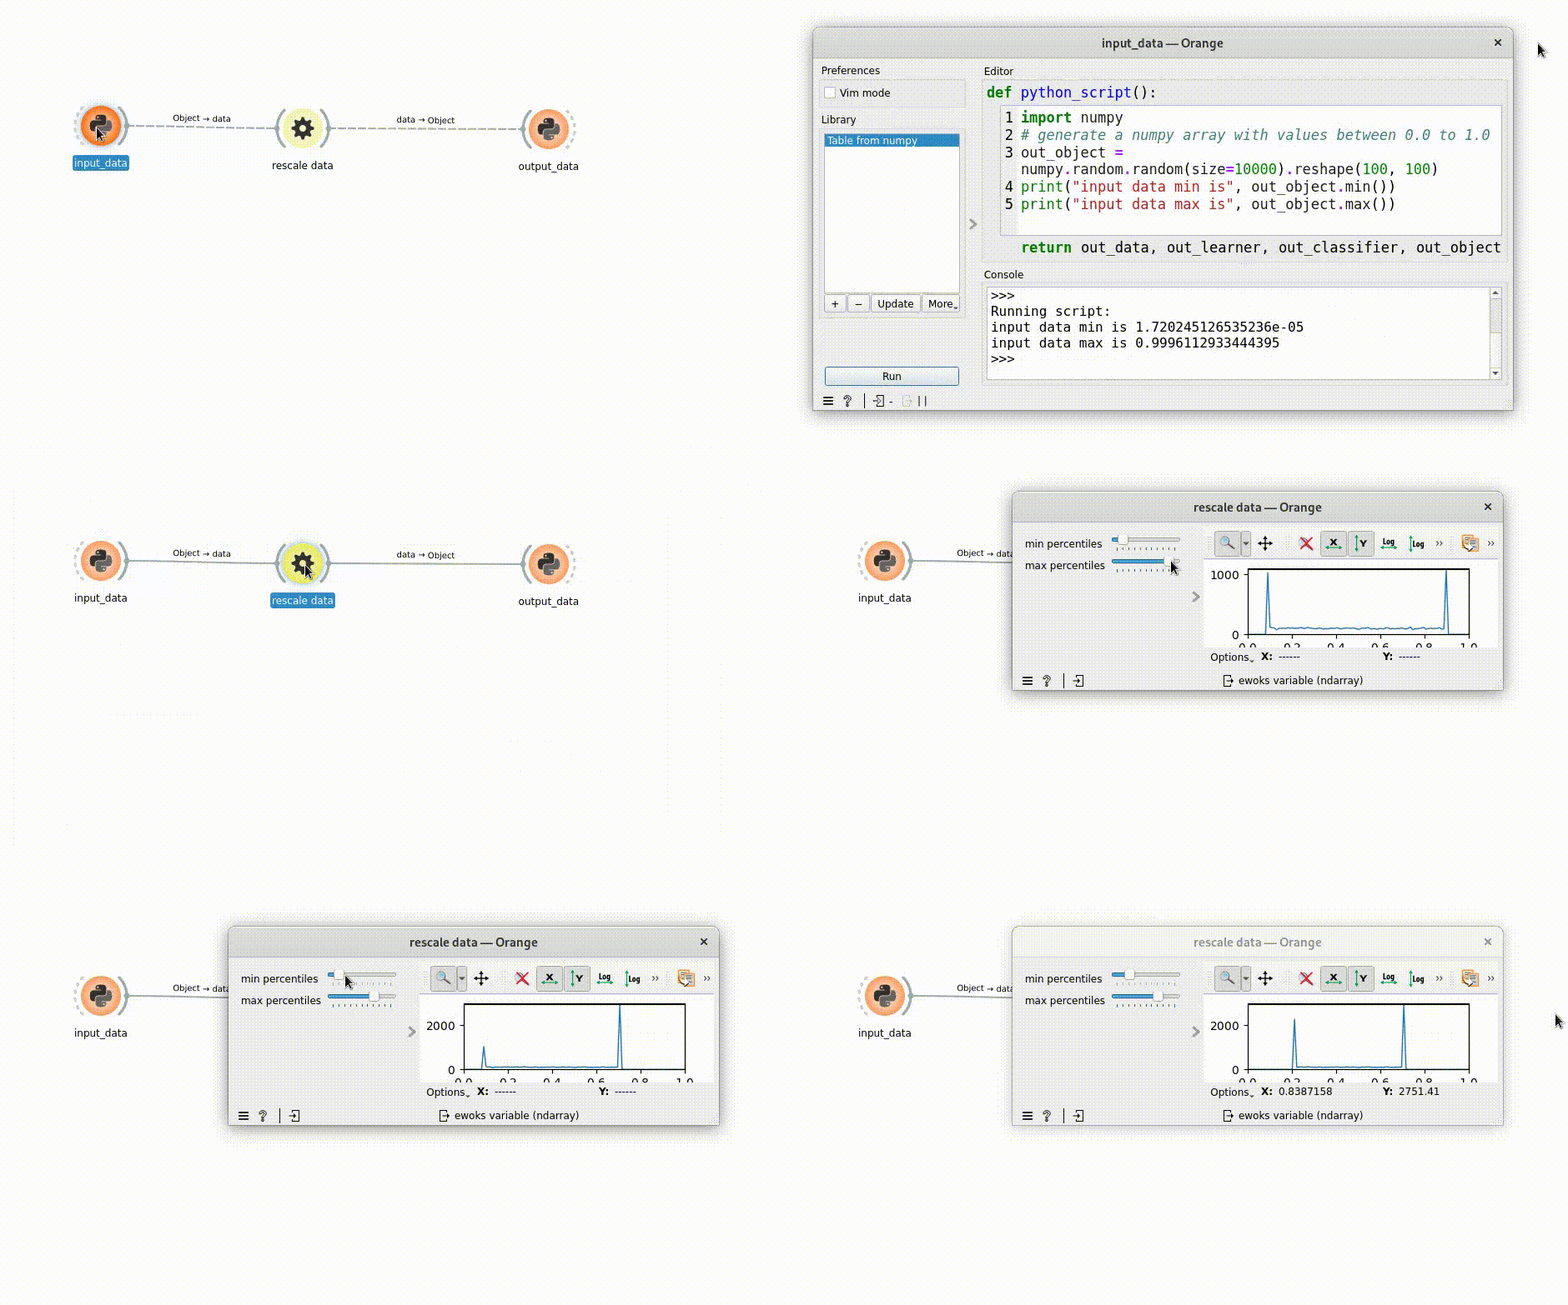
add a plot widget to ‘ClipDataOW’ that displays histogram values of ‘data’ in [0.0, 1.0]
update the plot widget when ewoks task output changes.
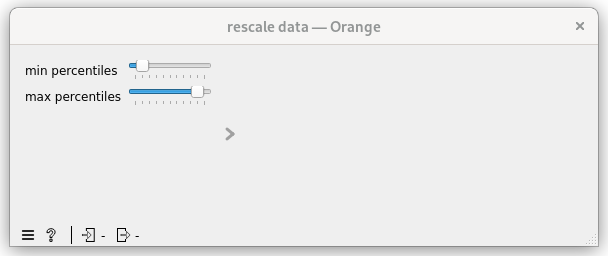
First let’s move the ‘MyWidget’ to the control area
From orange main area to control area#
diff --git a/src/orangecontrib/testtuto/ClipDataOW.py b/src/orangecontrib/testtuto/ClipDataOW.py
index 131e5da..606e74d 100644
--- a/src/orangecontrib/testtuto/ClipDataOW.py
+++ b/src/orangecontrib/testtuto/ClipDataOW.py
@@ -40,7 +40,7 @@ class ClipDataOW(
    id = "orange.widgets.my_project.ClipDataTask"
    description = "widget to clip data (numpy array) within a percentile range."
    want_main_area = True
-    want_control_area = False
+    want_control_area = True

    _ewoks_inputs_to_hide_from_orange = ("percentiles", )

@@ -48,7 +48,7 @@ class ClipDataOW(
        super().__init__(parent)

        self._myWidget = MyWidget(self)
-        self.mainArea.layout().addWidget(self._myWidget)
+        self.controlArea.layout().addWidget(self._myWidget)

        # set up percentiles
        self._myWidget.setPercentiles((10, 90))
Now the widget will looks like:

Adding a plot to the OrangeWidget#
 1class ClipDataOW(
 2    OWEwoksWidgetOneThread,
 3    ewokstaskclass=ClipDataTask,
 4):
 5    name = "rescale data"
 6    id = "orange.widgets.my_project.ClipDataTask"
 7    description = "widget to clip data (numpy array) within a percentile range."
 8    want_main_area = True
 9    want_control_area = True
10
11    _ewoks_inputs_to_hide_from_orange = ("percentiles", )
12
13    def __init__(self, parent=None):
14        super().__init__(parent)
15
16        self._plot = Plot1D(self)
17        self.mainArea.layout().addWidget(self._plot)
18        self._myWidget = MyWidget(self)
19        self.controlArea.layout().addWidget(self._myWidget)
20
21        # set up percentiles
22        self._myWidget.setPercentiles((10, 90))
23        self._percentileChanged()
24
25        # connect signal / slot
26        self._myWidget._minPercentiles.valueChanged.connect(self._percentileChanged)
27        self._myWidget._maxPercentiles.valueChanged.connect(self._percentileChanged)
28
29    def _percentileChanged(self):
30        self.set_dynamic_input("percentiles", self._myWidget.getPercentiles())
31        data = self.get_task_output_value("data")
32        if not is_missing_data(data):
33            self.execute_ewoks_task()
34
35    def task_output_changed(self):
36        data = self.get_task_output_value("data")
37        if is_missing_data(data):
38            self._plot.clear()
39        else:
40            # compute histogram
41            histogram, _ = numpy.histogram(data, bins=100, range=(0.0, 1.0))
42            self._plot.addCurve(x=numpy.linspace(0.0, 1.0, num=100), y=histogram, legend="histogram")
43        return super().task_output_changed()
Hint
l16-17: add a silx Plot1D widget and add it to the control area
l23: make sure the ‘percentiles’ is defined at start
l31-33: percentiles input will now be defined before data input (l23). So let’s make sure data is defined before processing the ewoks task.
l35-43: task_output_changed is called once the ewoks task has been processing:
If the task failed we clear the plot (l37-38)
Else we compute the histogram and display it.
Now your processing should looks like:

Hint
You can hide some input(s) you can also hide some output(s) using the _ewoks_outputs_to_hide_from_orange class attribute.
Results
from silx.gui import qt
from ewokscore.task import Task
from ewoksorange.bindings.owwidgets import OWEwoksWidgetOneThread
from ewokscore.missing_data import is_missing_data
from silx.gui.plot import Plot1D

import numpy


class ClipDataTask(
    Task,
    input_names=["data", "percentiles"],
    output_names=["data"],
):
    """
    Task to rescale 'data' (numpy array) to the given percentiles.
    """

    def run(self):
        data = self.inputs.data
        # compute data min and max
        percentiles = self.inputs.percentiles
        assert (
            isinstance(percentiles, tuple) and len(percentiles) == 2
        ), "incoherent input"
        assert percentiles[0] <= percentiles[1], "incoherent percentiles value"
        print("compute with", percentiles)

        self.outputs.data = numpy.clip(
            data,
            a_min=numpy.percentile(data, percentiles[0]),
            a_max=numpy.percentile(data, percentiles[1]),
        )


class ClipDataOW(
    OWEwoksWidgetOneThread,
    ewokstaskclass=ClipDataTask,
):
    name = "rescale data"
    id = "orange.widgets.my_project.ClipDataTask"
    description = "widget to clip data (numpy array) within a percentile range."
    want_main_area = True
    want_control_area = True

    _ewoks_inputs_to_hide_from_orange = ("percentiles",)

    def __init__(self, parent=None):
        super().__init__(parent)

        self._plot = Plot1D(self)
        self.mainArea.layout().addWidget(self._plot)
        self._myWidget = MyWidget(self)
        self.controlArea.layout().addWidget(self._myWidget)

        # set up percentiles
        self._myWidget.setPercentiles((10, 90))
        self._percentileChanged()

        # connect signal / slot
        self._myWidget._minPercentiles.valueChanged.connect(self._percentileChanged)
        self._myWidget._maxPercentiles.valueChanged.connect(self._percentileChanged)

    def _percentileChanged(self):
        self.set_dynamic_input("percentiles", self._myWidget.getPercentiles())
        data = self.get_task_output_value("data")
        if not is_missing_data(data):
            self.execute_ewoks_task()

    def task_output_changed(self):
        data = self.get_task_output_value("data")
        if is_missing_data(data):
            self._plot.clear()
        else:
            # compute histogram
            histogram, _ = numpy.histogram(data, bins=100, range=(0.0, 1.0))
            self._plot.addCurve(
                x=numpy.linspace(0.0, 1.0, num=100), y=histogram, legend="histogram"
            )
        return super().task_output_changed()


class MyWidget(qt.QWidget):
    def __init__(self, parent):
        super().__init__(parent)
        self.setLayout(qt.QFormLayout())

        self._minPercentiles = qt.QSlider(qt.Qt.Orientation.Horizontal)
        self._minPercentiles.setTickPosition(qt.QSlider.TickPosition.TicksBelow)
        self._minPercentiles.setRange(0, 100)
        self._minPercentiles.setTickInterval(10)
        self.layout().addRow(
            "min percentiles",
            self._minPercentiles,
        )

        # max percentiles
        self._maxPercentiles = qt.QSlider(qt.Qt.Orientation.Horizontal)
        self._maxPercentiles.setTickPosition(qt.QSlider.TickPosition.TicksBelow)
        self._maxPercentiles.setRange(0, 100)
        self._maxPercentiles.setTickInterval(10)
        self.layout().addRow(
            "max percentiles",
            self._maxPercentiles,
        )

    def setPercentiles(self, percentiles: tuple):
        self._minPercentiles.setValue(percentiles[0])
        self._maxPercentiles.setValue(percentiles[1])

    def getPercentiles(self) -> tuple:
        return (self._minPercentiles.value(), self._maxPercentiles.value())