How to test this first widget ?#
In this chapter we will:
how to do simple test of a new orangecontrib widget
Including the code in an orangecontrib section#
Orange offers a mechanism to include widget(s) to the orange canvas.
Too benefit of it your library must contain a ‘orangecontrib’ module. See Starting a new project from scratch chapter.
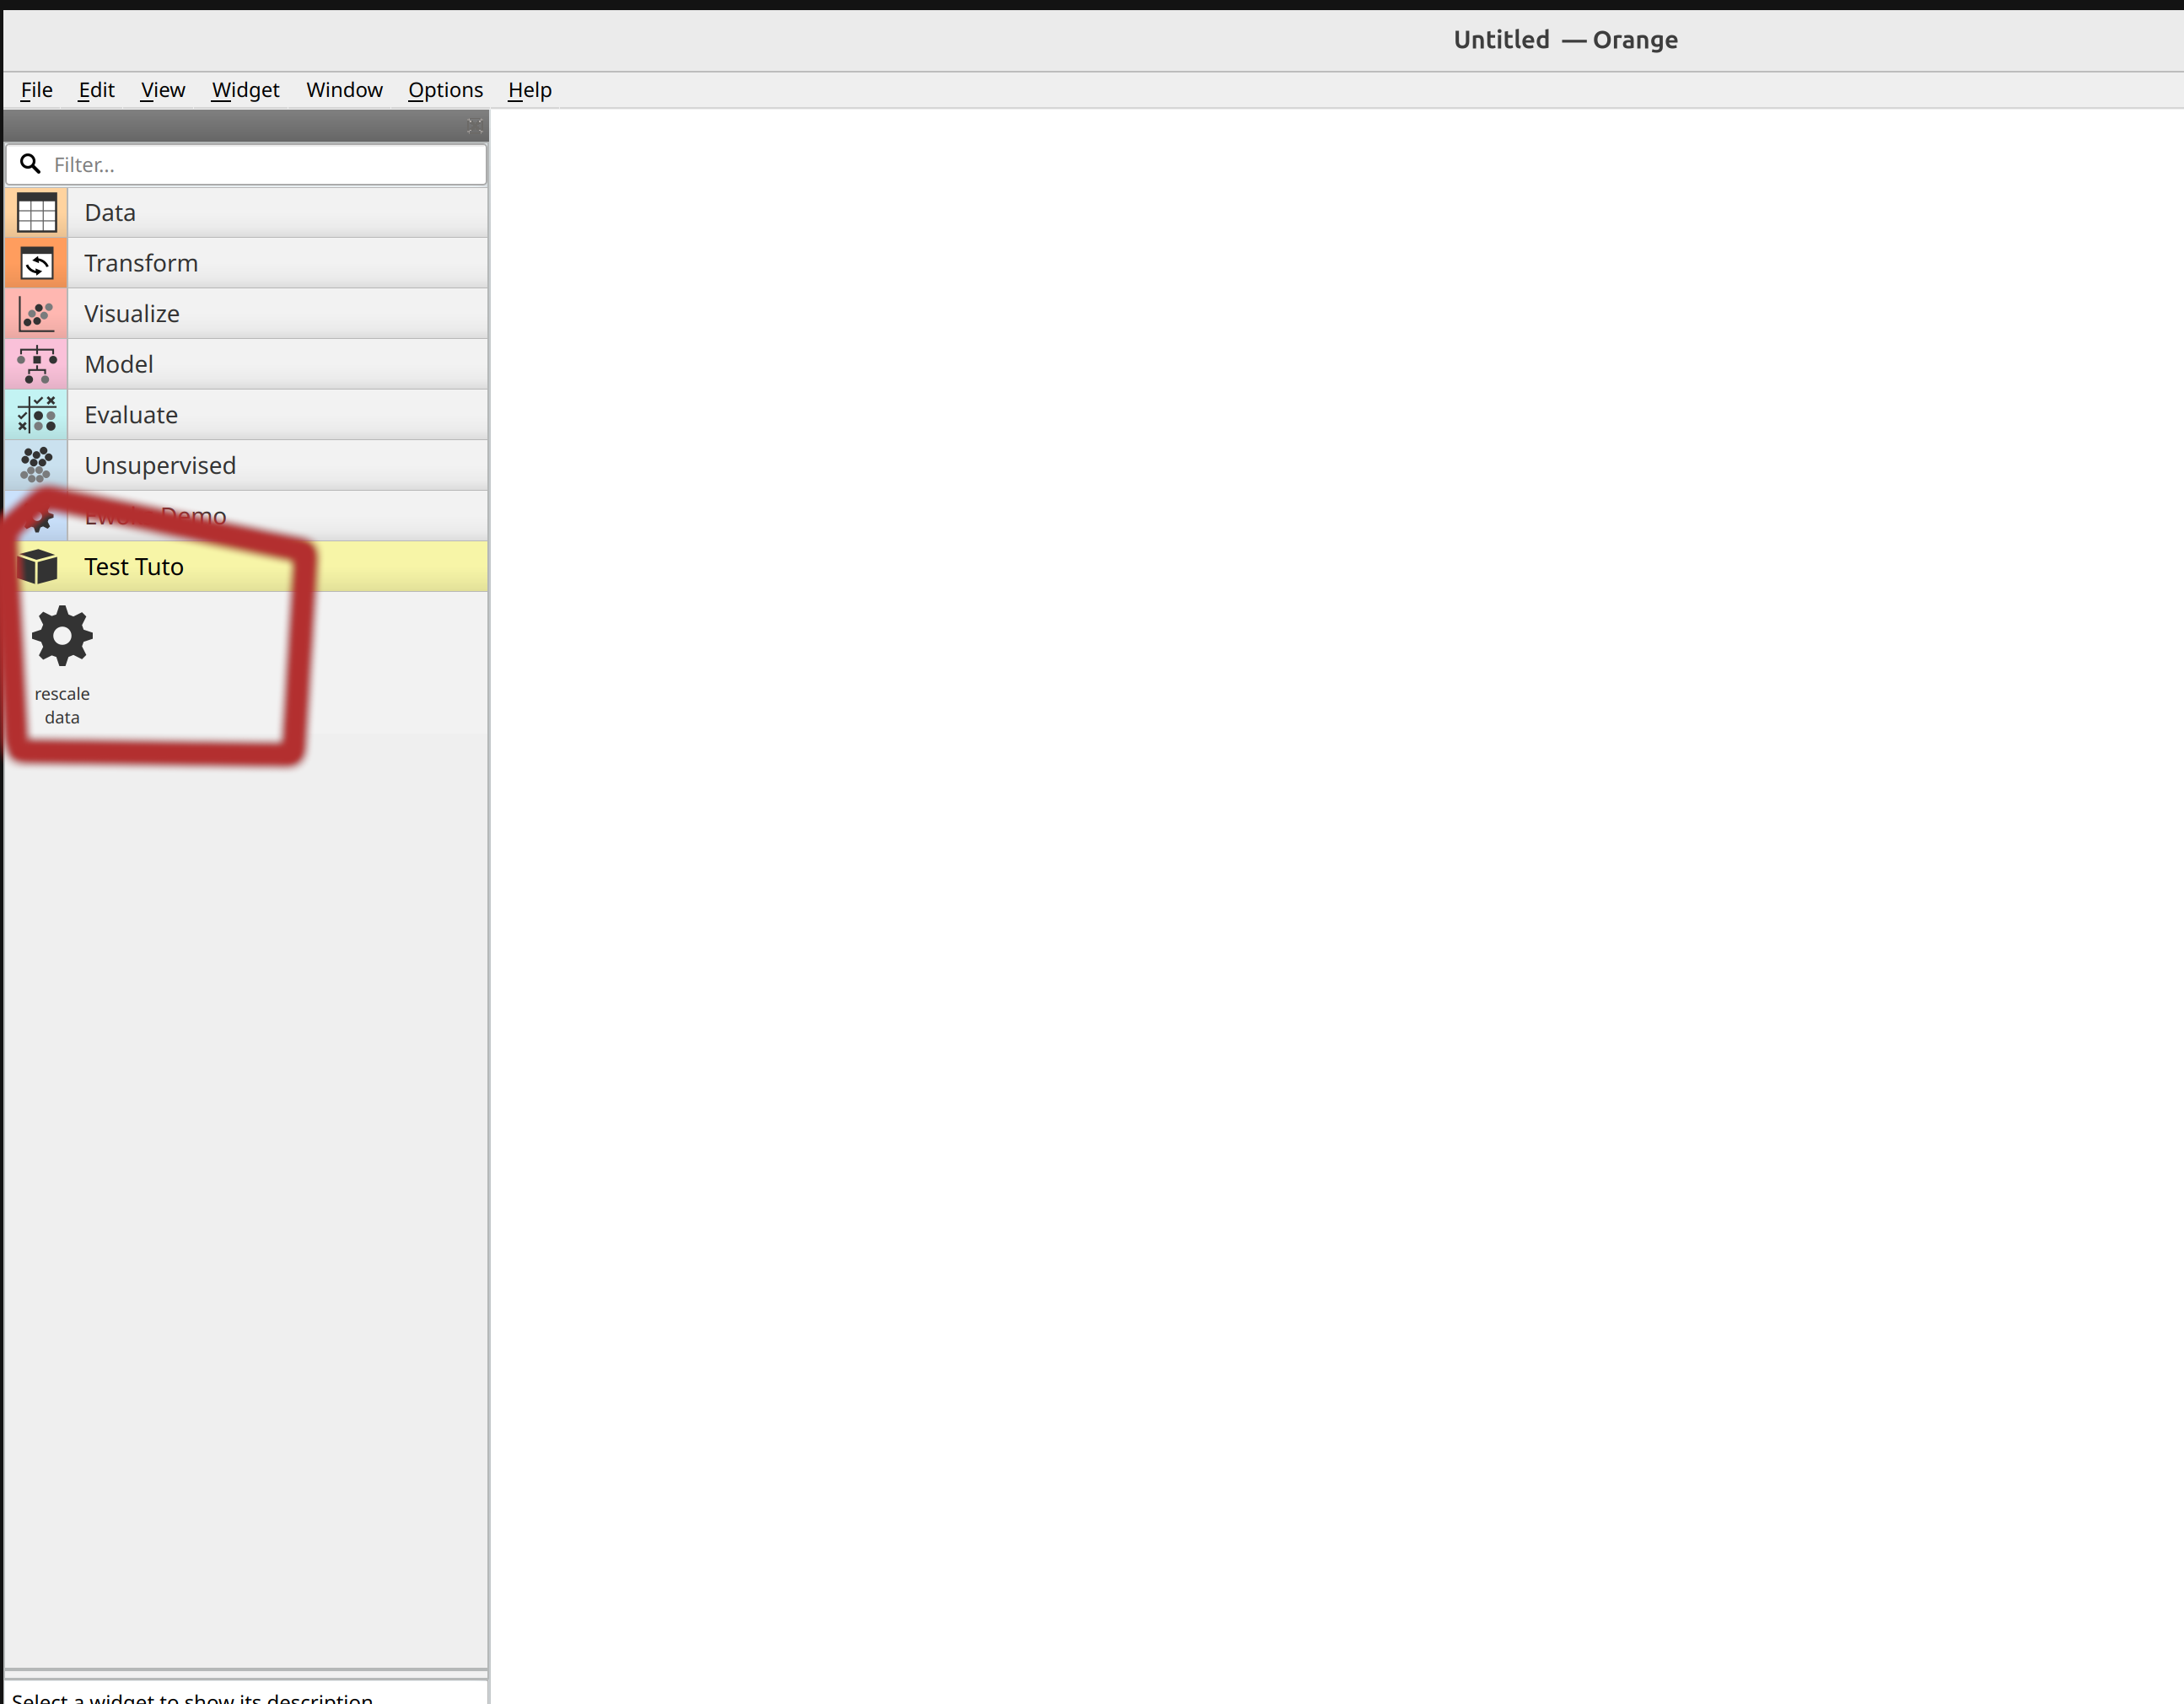
If your project is correctly configured you should now perceive the widget we are building:

Note
in this example we have an empty project with orange installed. The ClipDataOW has been added in a Test Tuto orangecontrib.
Hint
ewoks-canvas is automatically launching the widget discovery. If you are using orange-canvas instead you might need to use the –force-discovery option.
Warning
each Orange widget should be in a dedicated file. Else orange parsing will fail.
Test it with ‘Orange3 python script’ widget#
Orange3 package offers the ‘python script’ widget which are very convenient for testing.
Make sure you have Orange3 installed:
pip install Orange3
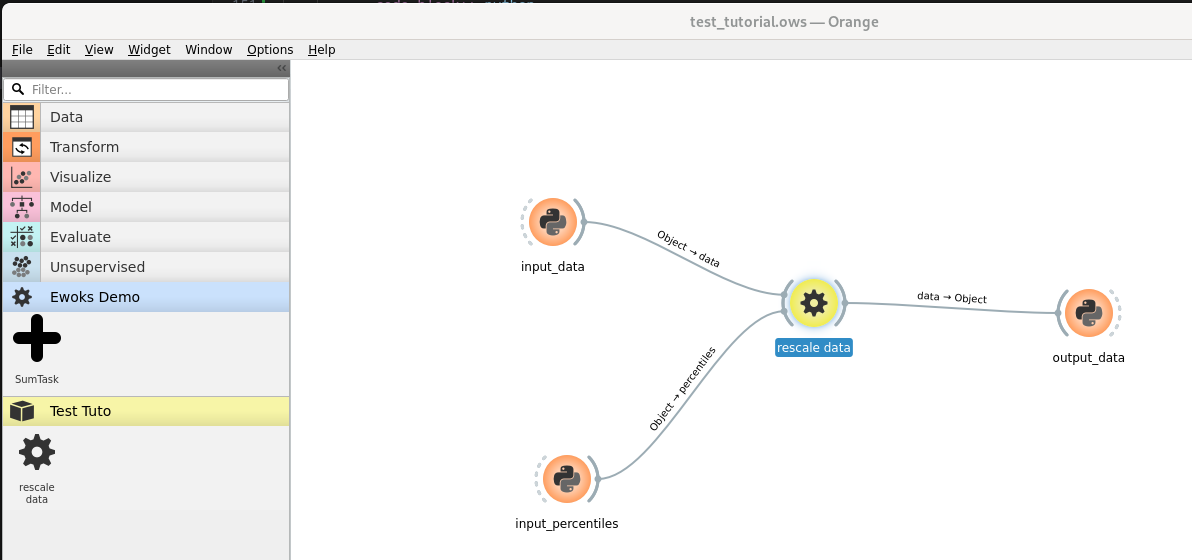
Then you will be able to create a workflow like

Now we can provide the task inputs from the two widgets ‘input_data’ and ‘input_percentiles’ and print the output data from output_data widget. Here is the source code we will used in each of the widgets:
import numpy
# generate a numpy array with values between 0.0 to 1.0
out_object = numpy.random.random(size=10000).reshape(100, 100)
print("input data min is", out_object.min())
print("input data max is", out_object.max())
out_object = (10, 90)
print("output data min is", in_object.min())
print("output data max is", in_object.max())
when running the first two python widget we get:
Running script:
output data min is 0.10002332932732391
output data max is 0.9068068838817003
If you have a close result then you can move to the next section.